How to open the developer console
The developer console is a tool that helps log details about the backend operations of the site and application. The information logged in the console can help our team solve any issue that you may experience. To assist with troubleshooting any site errors, please send a screenshot along with the suggested tech issue.
For Chrome:
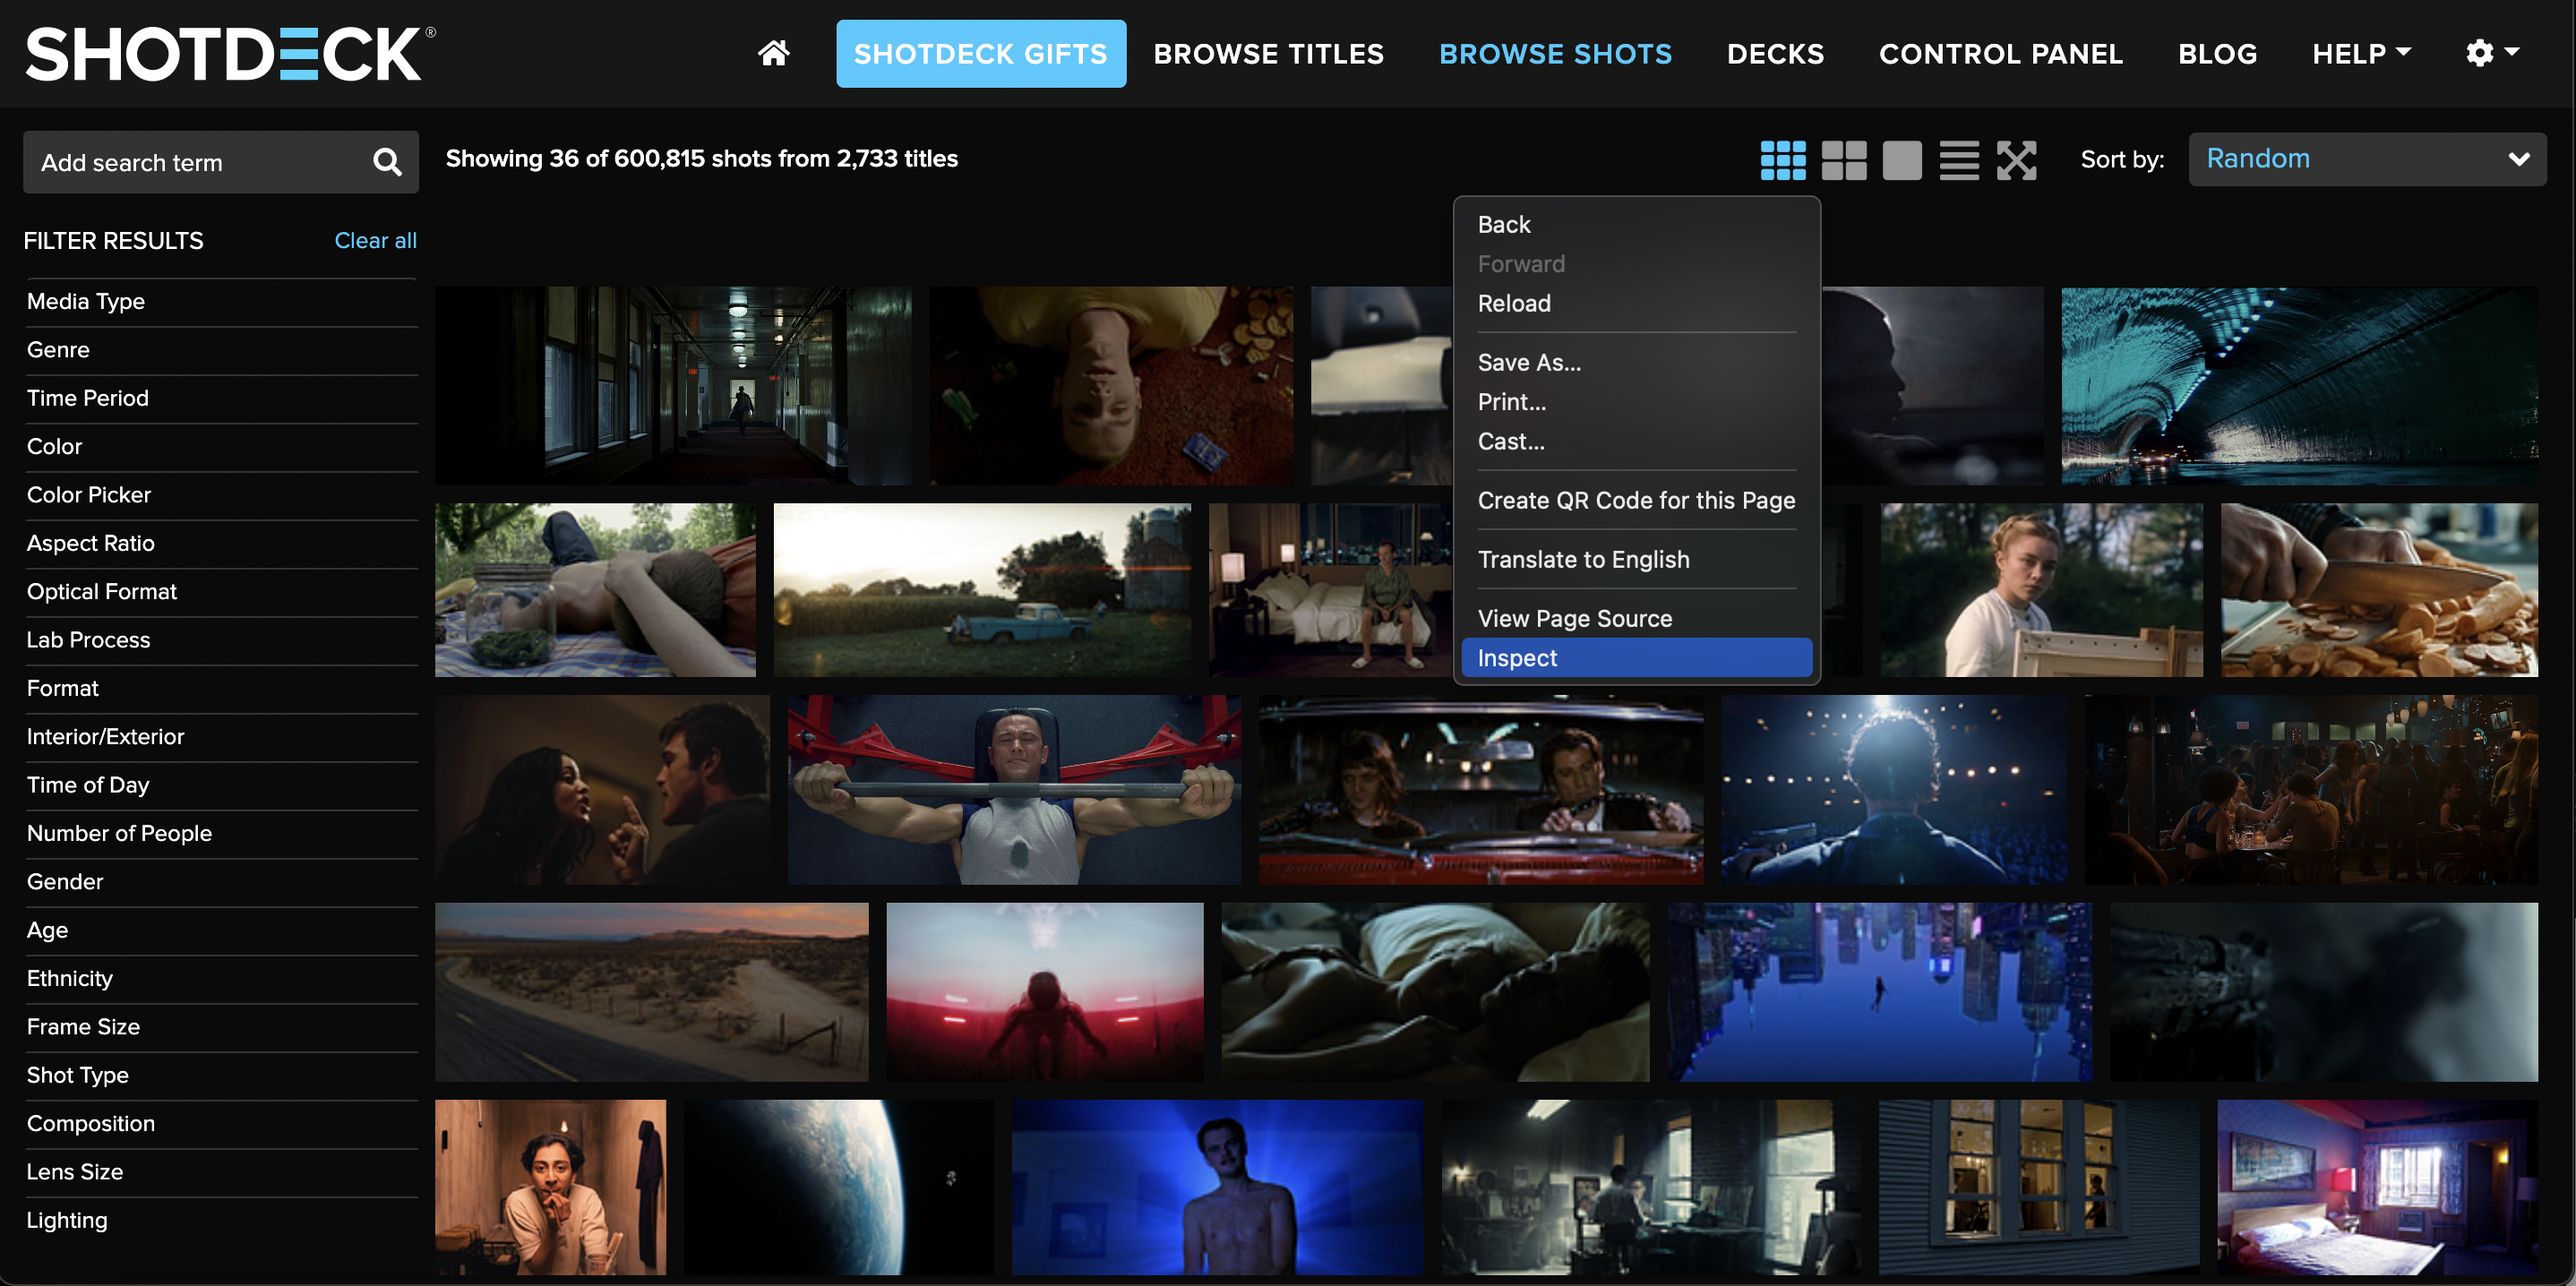
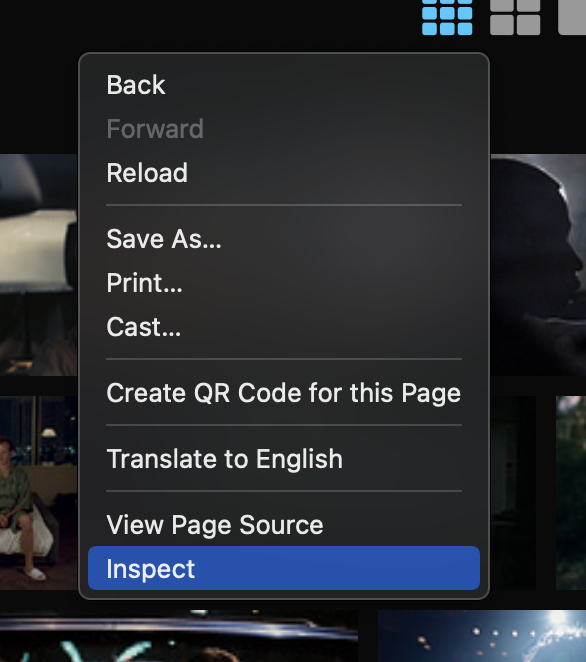
- Right click on the browser window and select “Inspect”
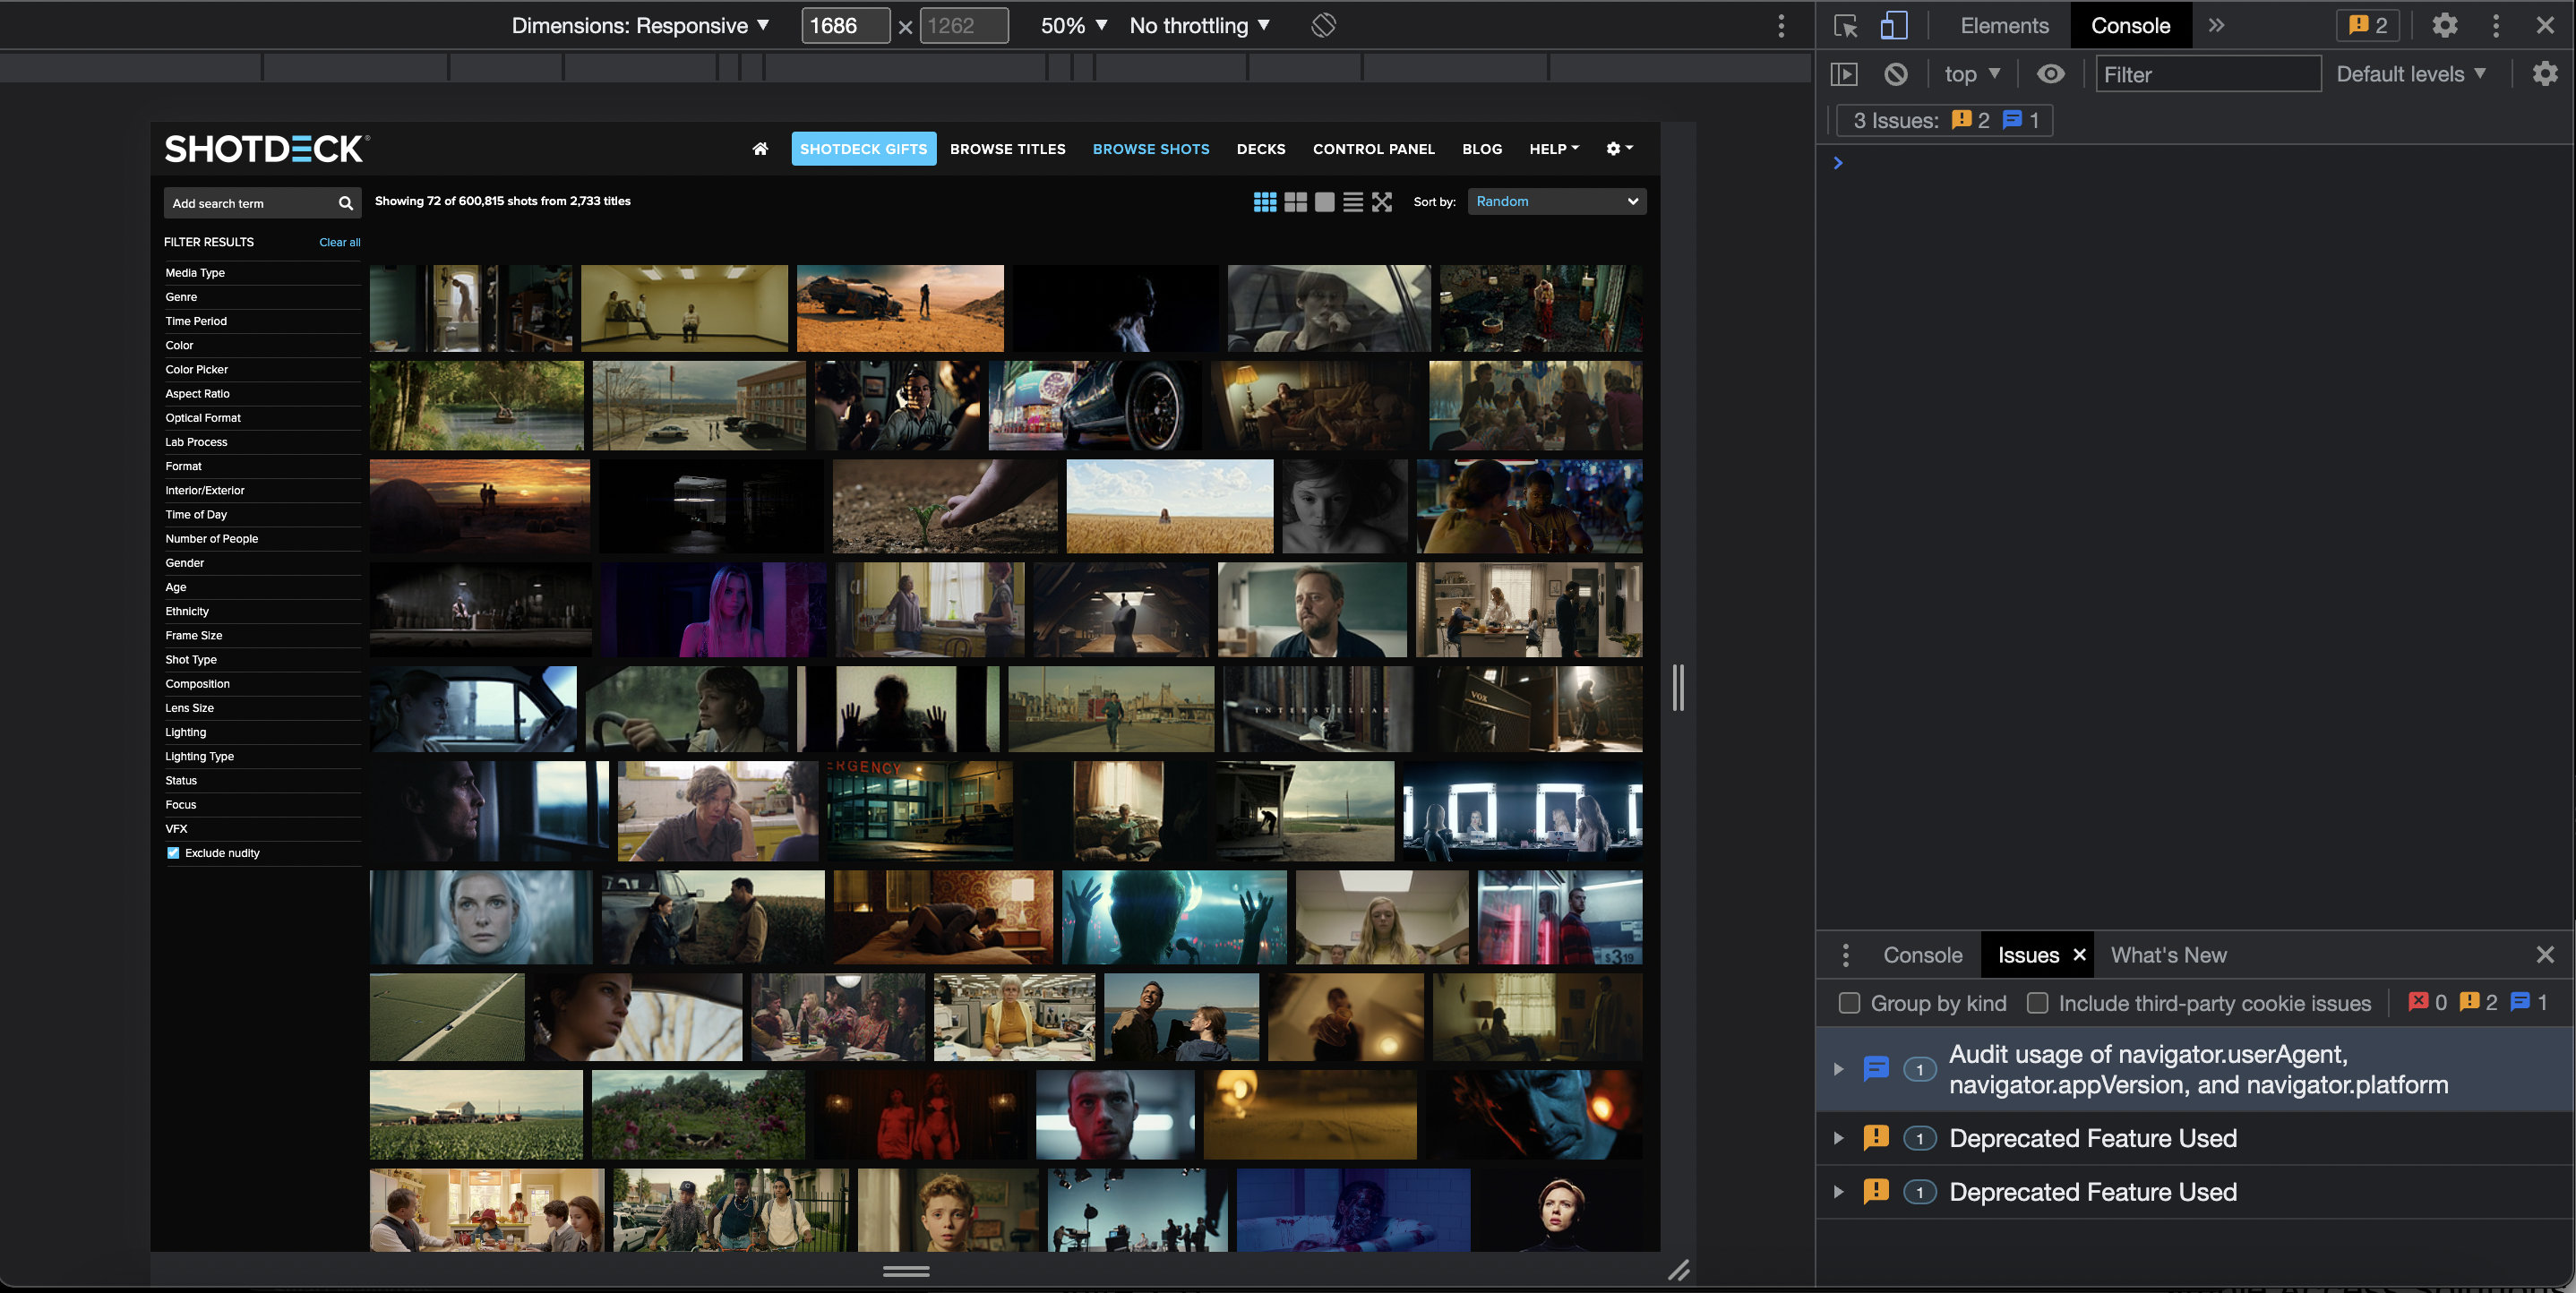
- The console tab will show either at the top or bottom of the screen. Select “Console”
- Grab a screenshot of the full screen and send to the Shotdeck team with a detailed description of the issues you’re having on the site.
For Firefox:
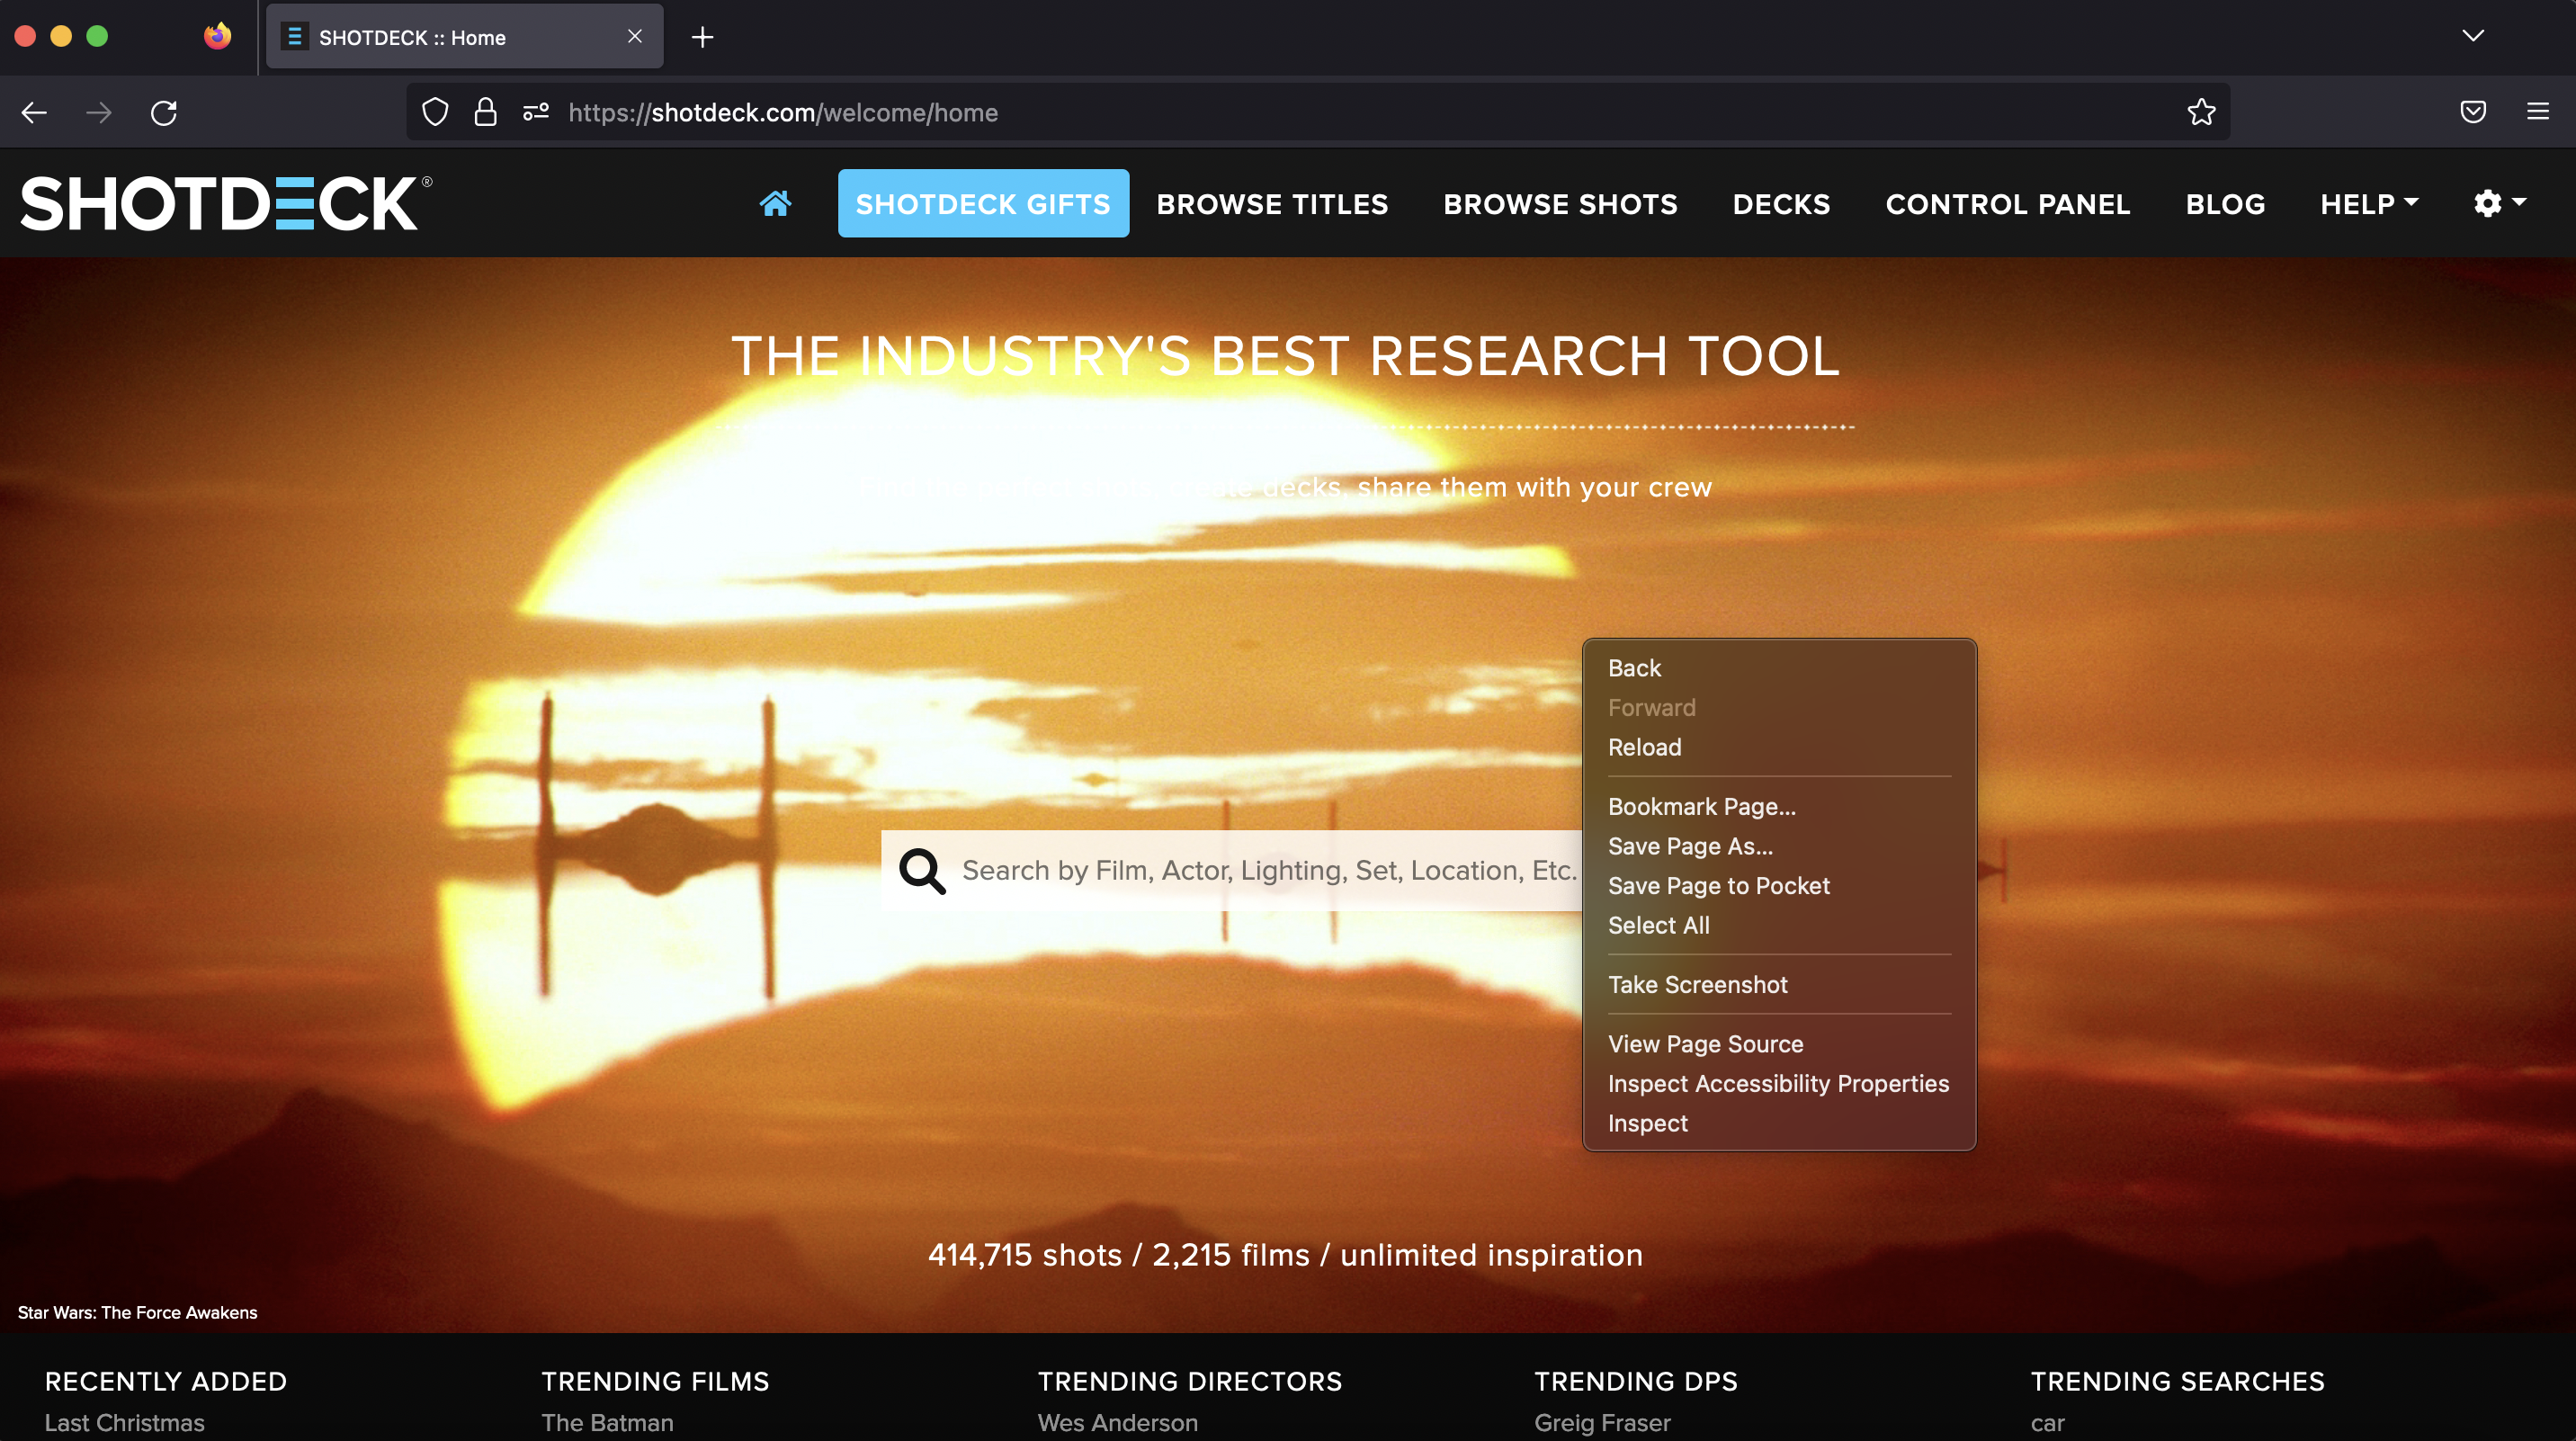
- Right click on the browser window and select “Inspect”
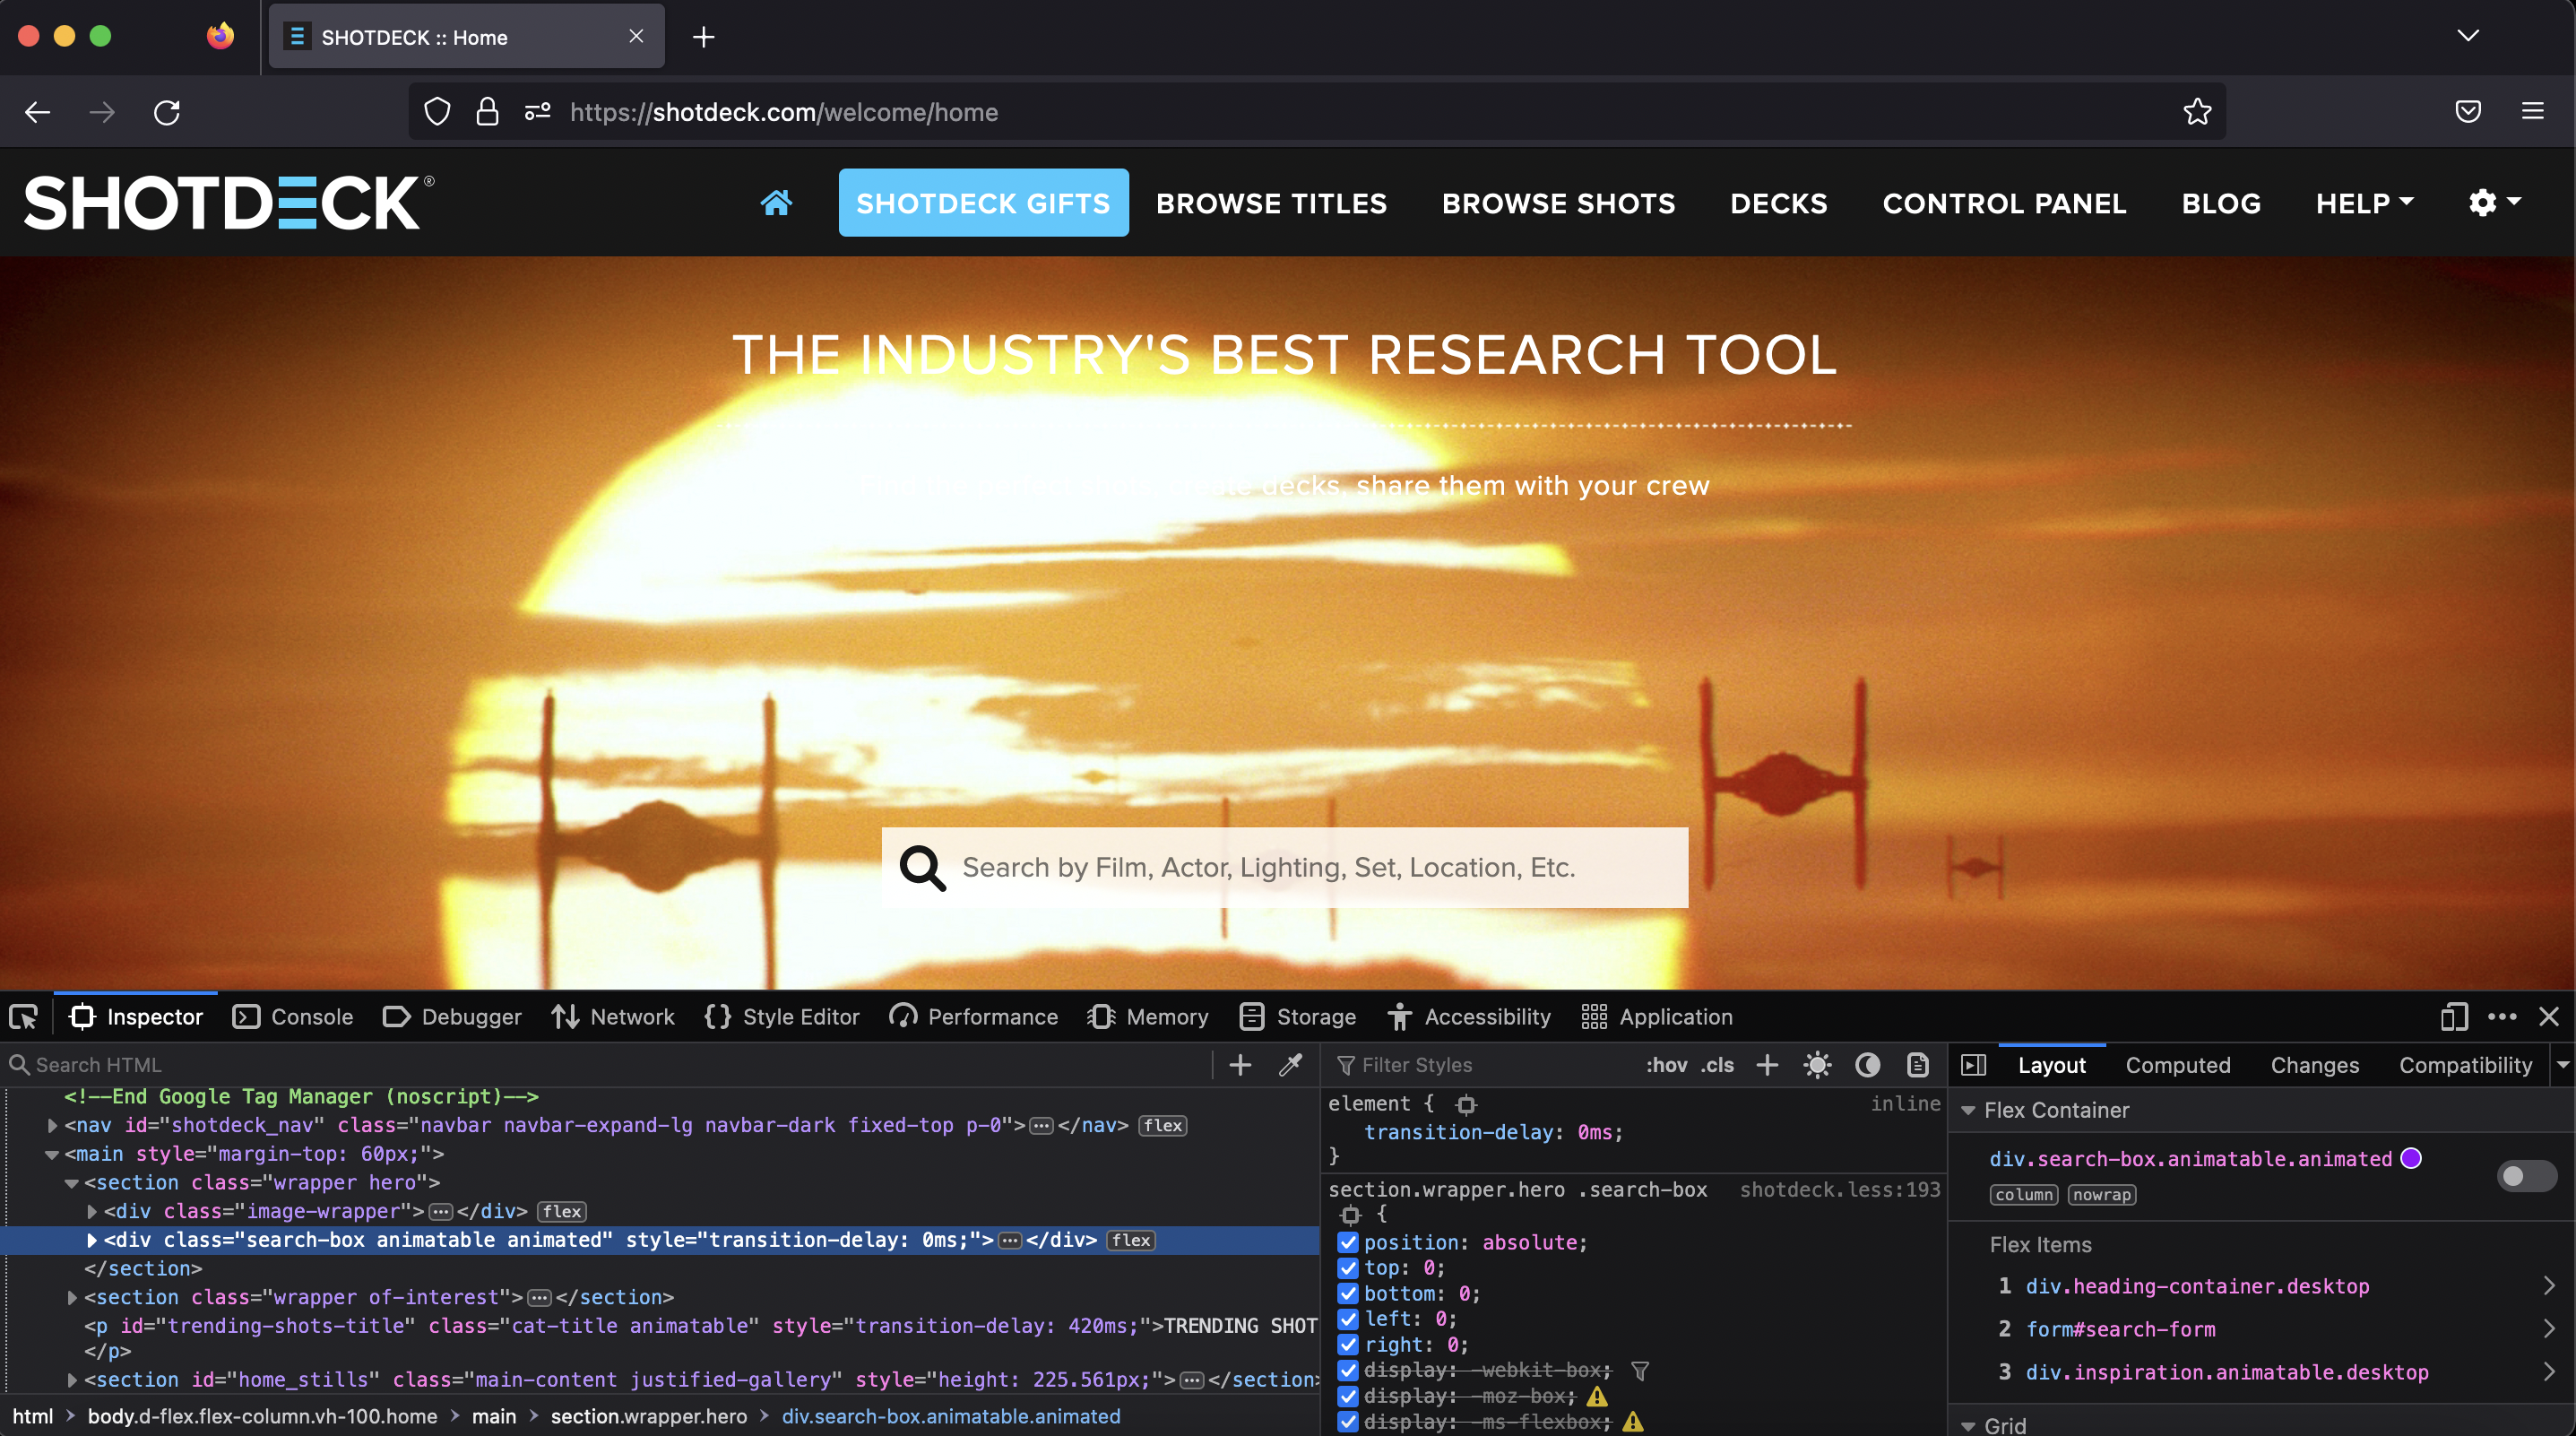
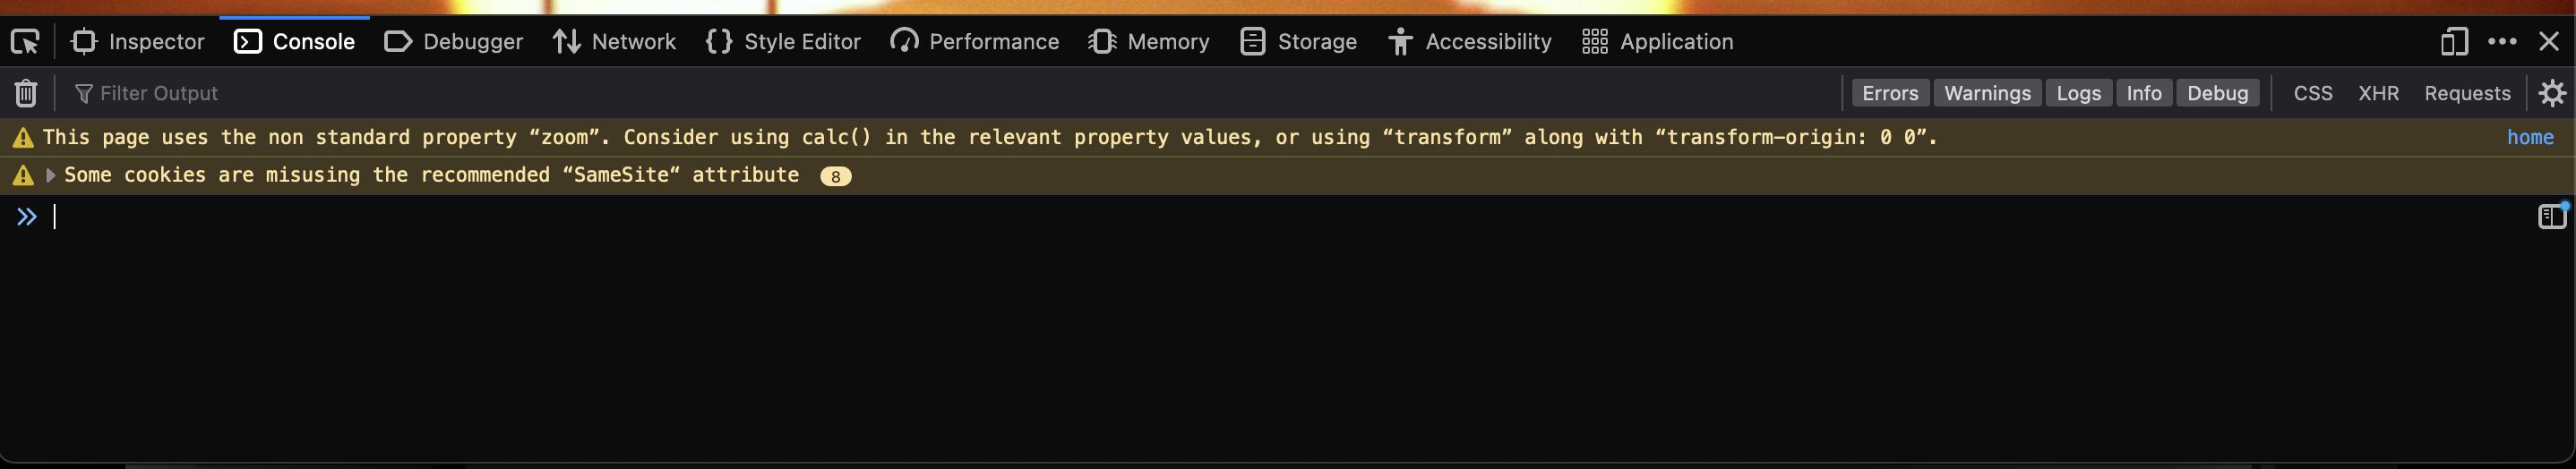
- The console tab will show either at the bottom or the right of the screen. Select “Console”
- Grab a screenshot of the full screen and send to the Shotdeck team with a detailed description of the issues you’re having on the site.